Tratamiento y cuidados

Comprender qué afecta a tus niveles de glucosa en sangre

Conclusiones clave

  • Los alimentos que consumes, tu actividad física y los medicamentos que tomas influyen en tus niveles de glucosa en sangre.
  • Controlar tus niveles de glucosa en sangre te ayudará a comprender cómo la alimentación y la actividad física los afectan.
  • Saber más sobre cómo ciertos alimentos y actividades afectan tu nivel de glucosa en sangre te ayudará a tomar decisiones sobre qué comer, qué tan activo debes ser y qué medicamentos tomar para controlarlo mejor.

How can using my CGM help me manage diabetes?

Knowing what affects your blood glucose (blood sugar) is key to managing diabetes. It can be hard to know what causes your blood glucose to go too high (hyperglycemia) or too low (hypoglycemia). Monitoring your blood glucose lets you be the detective and discover how factors such as food, physical activity, and medications affect you and make changes as needed. 

How does a CGM work? 

A CGM is a small wearable device that provides readings based on the fluid around your cells (interstitial fluid) and reports these readings as “glucose.” Because these readings are based on interstitial glucose and not blood glucose, the readings will be about 5–15 minutes behind a finger stick blood glucose level. CGMs report glucose regularly throughout the day and show if your glucose is trending up or down. 

How will I know my goal range? 

You will work with your healthcare team to create your glucose goals. For most people, the overall goal is to keep your glucose between 70–180 mg/dL about 70% of the time or more.  

Understanding Your CGM Data 

Your CGM gives you your glucose when you check it but it also gives you the following: 

Image
Smartphone displays diabetes 'Time in Range' data: 78% in range, with high/low percentages.

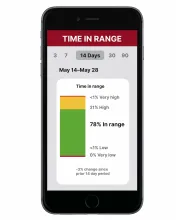
 Time in range: Your time in range graph shows you how much time your glucose was in your target range. It also shows you the percentage of time you were above or below your target range. 


Image
Smartphone displays a daily blood glucose graph showing levels and a green target range.

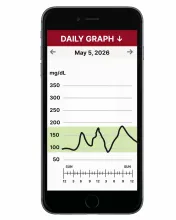
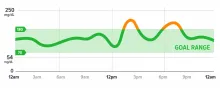
 Daily graph: The daily graph helps you see if your glucose is in your target range and when your glucose levels went too high or too low. Most CGMs will allow you to personalize your target range.


Image
Smartphone screen with blood glucose 145 mg/dL (rising) and a trend graph.

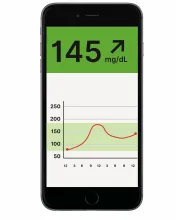
 Trend arrows: Trend arrows can help you quickly see if your glucose is rising or dropping. 


How to Use CGM Data to Identify Trends and Factors 

Using your CGM to check your glucose regularly will allow you to notice how food, activity, stress, medication, and other factors play a part in how your glucose levels change. With this information, you can work with your healthcare team to make changes to your treatment plan, if needed. 

 Use the steps below to help you understand your glucose readings. 

1. Review your daily graph. 

A good way to see if you’re reaching your goals is to look at your daily graph. Here you can see if your glucose is within your target range and when your glucose levels go too high or too low.  


Image
Blood glucose graph with levels mostly within the 64-150 mg/dL goal range over 24 hours.

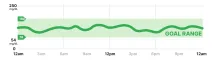
 Here’s an example CGM graph staying within the target range of 70–180 mg/dL.


Image
Blood glucose graph over 24 hours showing a 'GOAL RANGE'. Two orange spikes indicate high levels.

Here’s an example CGM graph of glucose peaking higher than your target range.


2. Think about what caused your glucose to go outside your target range. 

Using the glucose readings from your CGM, you can figure out what factors had the biggest effect on your glucose levels. Think about what happened in the hours leading up to an out-of-range reading: 

  • What did I eat and drink?
  • Was my glucose trending up or down before I ate?
  • Did I eat earlier or later than usual?
  • Were my portions different than usual?
  • What types of food did I eat?
  • What type of carbs did I eat?
  • How many carbs did I eat? 


  • How active have I been?
  • Was my physical activity more or less intense than usual?
  • Was I physically active for a longer or shorter period of time?
  • Did I eat or drink something different than usual before, during, or after physical activity? 
  • Did something happen with my medication?
  • Was the timing different?
  • Was the amount different?
  • Is the medication expired? 
  • How much water did I drink? Am I dehydrated?
  • Am I more stressed or dealing with more emotionally challenging situations than usual?
  • How did I sleep well and long enough last night?
  • Am I sick or is something causing ongoing pain like a muscle strain or a sunburn? 

Over time, look for patterns to get an idea of what is regularly affecting your readings. 

How to Safely Make Changes Using CGM Data 

Once you identify any factors that could have caused your glucose to go too high or low, think about what you can change to help you stay in your target range in the future. Start with a small change to what you eat or physical activity and look at your glucose readings after the change to find out how it affected them.  

Example of Using a CGM to Identify Trends and Try a Change 

Example: Looking at his CGM, Chris notices that he is spending more time below his target range than his goal. He looks at his daily graphs over the last few weeks and sees his low values are occurring at nighttime. After chatting with his healthcare team about it, he tries having a bedtime snack with carbohydrates and protein, and this helps him stay in range through the night. He has fewer lows and his time in range increases. 

If you’re out of range often, talk with your healthcare team. They can help you decide what changes might help you reach your targets and if your treatment plan needs to be updated. 

What if I’m using an automated insulin delivery system? 

A CGM can work together with an insulin pump as part of an automated insulin delivery (AID) system to automatically adjust your insulin. If you’re using an AID system, it’s less likely that you’ll find your glucose outside your target range. You can still use your CGM to better understand your glucose trends, help you set and reach goals, and make changes to support your health. 

Next Steps 

  • By looking at your time in range, daily graph, and trend arrows provided by your CGM, you can find out what’s leading to changes in your glucose levels.
  • Based on what you discover, you can make small changes and continue to use your CGM to find out how those changes affected your glucose levels.
  • You can also work with your healthcare team to make changes to your treatment plan that will help you spend more time in your target range. 

Now that you know how to use your CGM to know what’s affecting your glucose levels, you can learn more about the different factors that can impact your glucose levels.